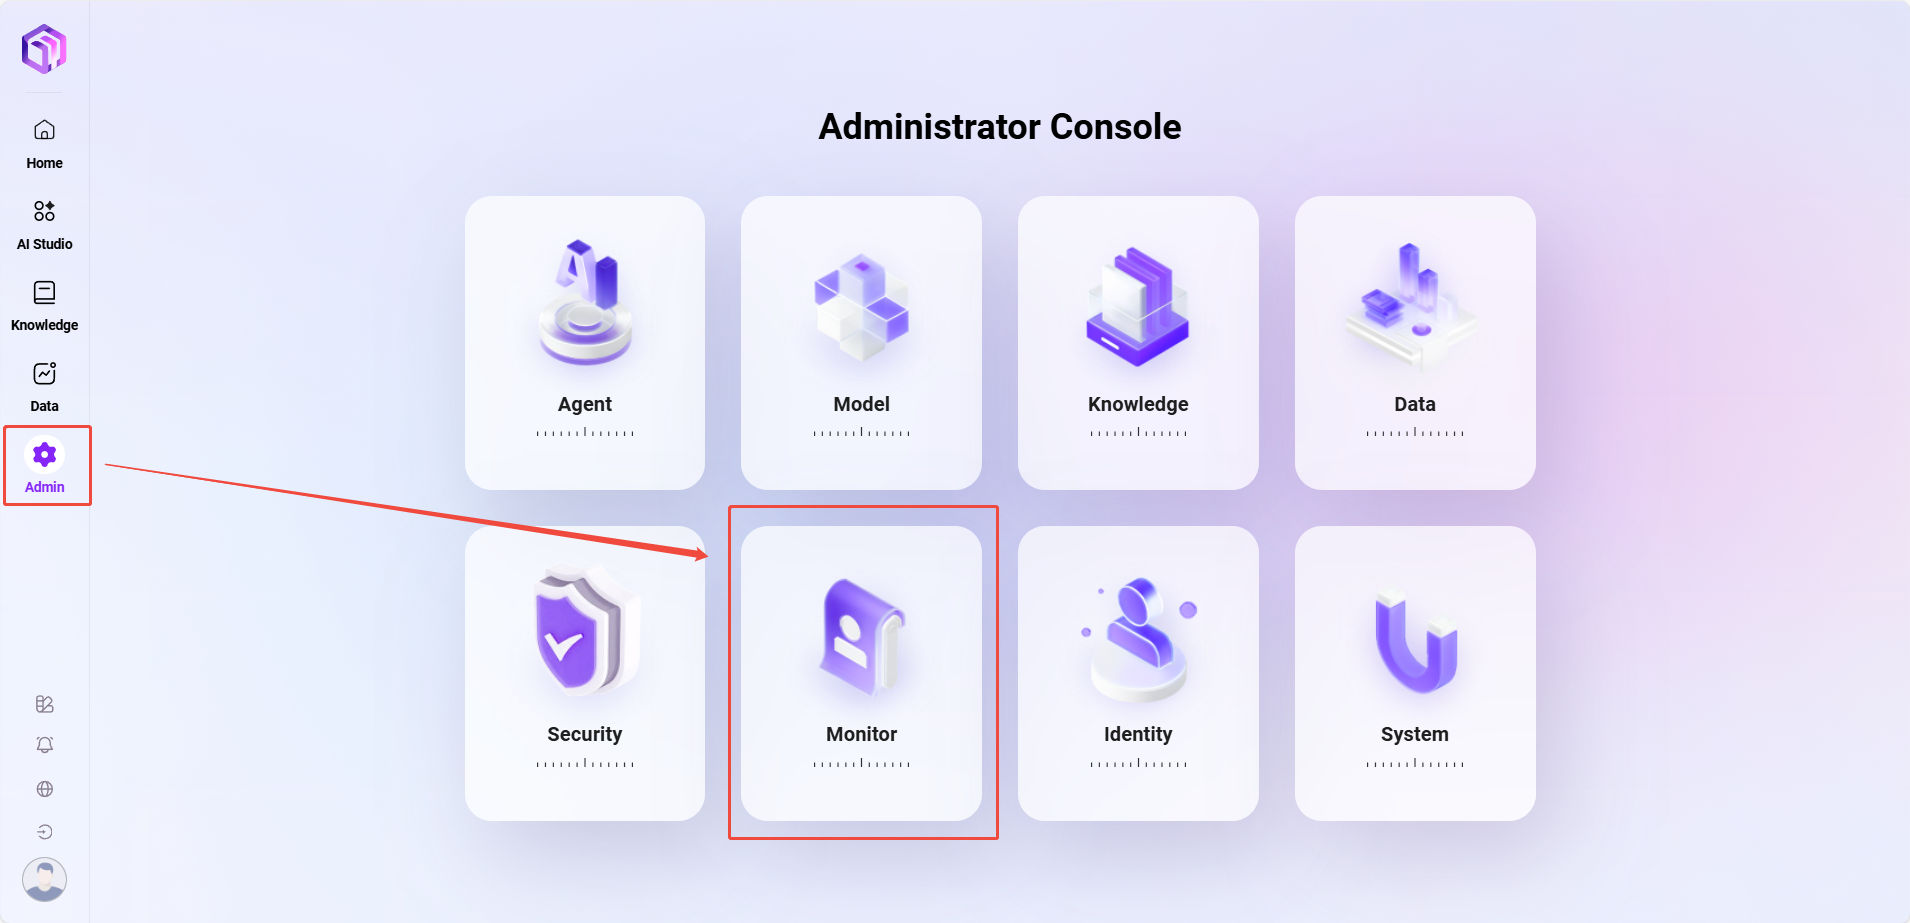
Monitoring Management
The entry point for log monitoring is shown below:
Intelligent Agent Monitoring
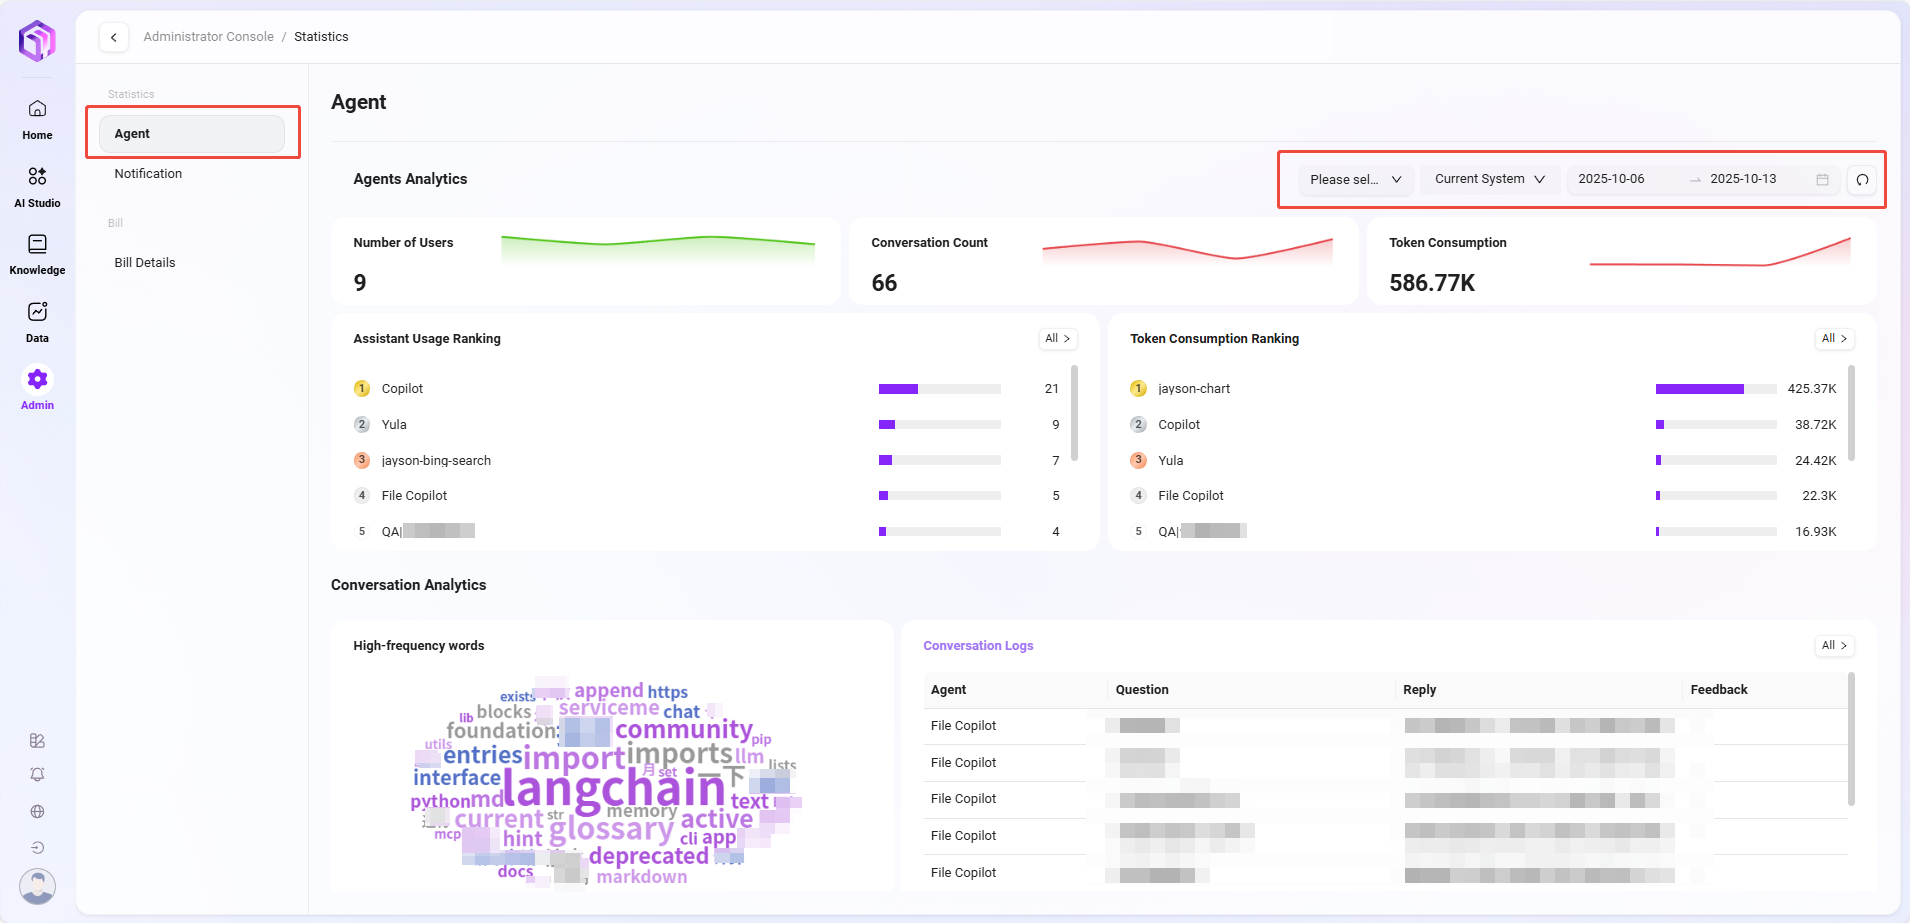
The data center provides comprehensive statistics and analysis on the usage of intelligent assistants and user conversation content, helping users better understand the effectiveness and operational status of AI, optimizing management and decision-making.
The data center supports data statistics from the assistant dimension, system API dimension, and time dimension.
Assistant Analysis
This section focuses on quantitative analysis of the usage of each AI assistant, including:
- Number of Users: The number of unique users who have interacted with the assistant.
- Number of Conversations: The total number of interactions between users and the assistant, measuring usage activity.
- Token Consumption: Measures the resource consumption of model calls during assistant operation.
- Assistant Usage Ranking: Ranks all assistants by usage frequency to identify high-frequency assistants.
- Token Consumption Ranking: Statistics on Token usage by each assistant, aiding resource optimization and cost control.
Conversation Analysis
This section delves into the conversation content between users and assistants, gaining insights into user needs and interaction patterns, including:
- High-Frequency Vocabulary Analysis: Extracts keywords from user conversations to identify focus areas and demand trends.
- Conversation Logs: View historical conversation details for quality review, issue troubleshooting, and content auditing.
💡 Tip: Conversation count statistics and assistant usage rankings are updated once daily; other information such as conversation logs is updated in real time.
Notification Management
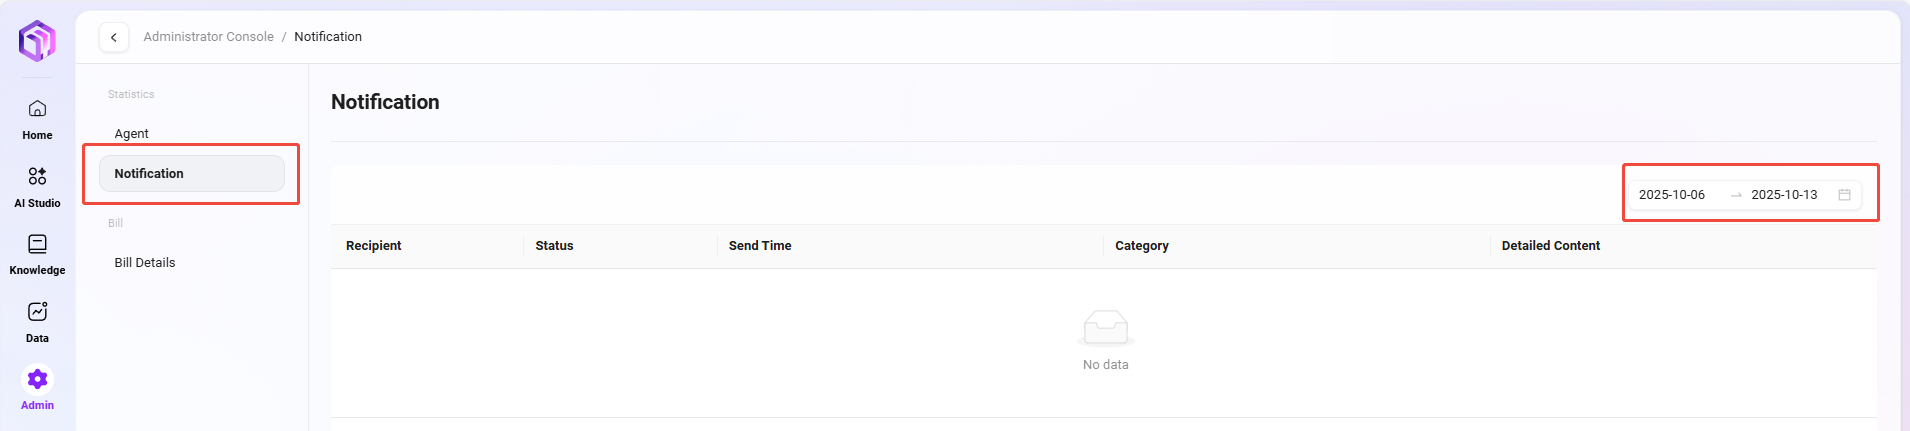
Notification management is used to count and view all types of notification messages received by users in the system. Through this feature, administrators can track the delivery status of notifications, understand whether users have read them, and whether the notification content has been effectively conveyed.
For example: When a user interacts with an intelligent agent and provides feedback on the agent's response, the system sends a feedback notification to that user. Such notifications are recorded and displayed in notification management.
Feature Description
On the notification management page, the following information can be viewed:
- Recipient: The user account or username who received the notification
- Notification Status: Whether the notification has been read (Read / Unread)
- Send Time: The specific time the system sent the notification
- Notification Content: Detailed information of the notification, supporting viewing of original prompts, feedback results, etc.
- Notification Category: The classification of the notification, such as feedback notification, system notification, task reminder, etc.
💡 Tip: Supports filtering notifications by time dimension
Billing Details
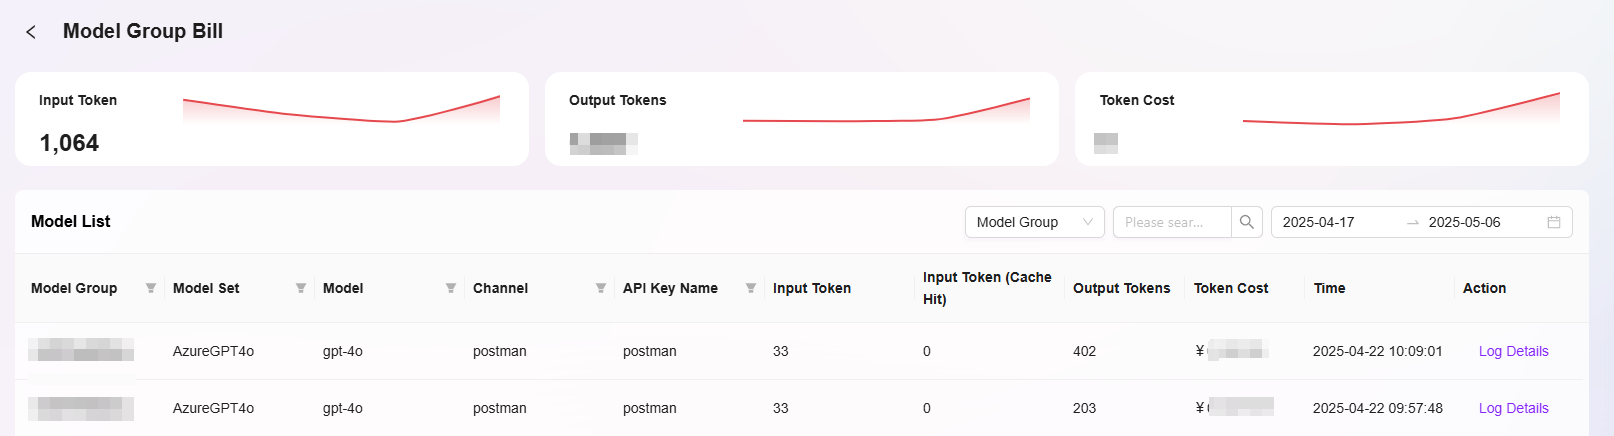
In the SERVICEME system, you can view detailed billing information for Token usage. The line chart at the top of the interface shows the changes in Token-related values at different time points, providing an intuitive display of usage trends. The table below records in detail the Token consumption and corresponding costs of various models within a specific time period, and lists related usage types and other information, facilitating a clear understanding of the billing situation for each Token usage.
Information Provided on the Billing Details Page
The billing details interface allows viewing of the following information:
- Model Group: Displays the group category to which the model belongs.
- Model Set: Indicates the collection name to which the model belongs.
- Model: Shows the specific model name used.
- Channel: Identifies the pathway through which the model operates.
- API Key Name: Displays the name of the API key used to access the model.
- Input Token: Records the number of Tokens input into the model.
- Input Token (Cache Hit): Shows the number of Tokens input when a cache hit occurs.
- Output Token: Displays the number of Tokens consumed by the model's output.
- Token Cost: Lists the cost incurred by Token usage.
- Time: Records the specific time when the model operation occurred.
- Operation: Provides executable options such as viewing log details.
Purpose of Billing Details
- Real-time Monitoring of Token Consumption: Through billing details, administrators can view the Token consumption of models in real time and judge usage trends based on the line chart.
- Cost Tracking: Facilitates tracking of costs for each operation, helping administrators control expenses.
- Log Viewing: Through the view log details function provided in the operation column, users can gain in-depth understanding of each model operation's specific content, aiding in troubleshooting.